XMPP Newsletter Banner
Welcome to the XMPP Newsletter, great to have you here again! This issue covers the month of April 2026.
The XMPP Newsletter is brought to you by the XSF Communication Team.
Just like any other product or project by the XSF, the Newsletter is the result of the voluntary work of its members and contributors. If you are happy with the services and software you may be using, please consider saying thanks or help these projects!
Interested in contributing to the XSF Communication Team? Read more at the bottom.
XSF Announcements
XSF Membership
Being an elected member of the XMPP Standards Foundation signals a commitment to open standards and professional engagement in / with the XMPP community. Here, your membership helps position the XSF as a healthy organization, which in itself is valuable. It also grants voting rights on technical and administrative matters within the XSF. The application is a light-weight and free of cost process and you can use your membership to get more involved more easily, too. If you are interested in joining the XMPP Standards Foundation as a member, please apply to our 2nd quarterly call for members admissions before May 17th, 2026, 00:00 UTC.
XMPP Events
- XMPP Sprint in Berlin (DE / EN): will take place in June, from Friday 19th to Sunday 21st 2026, at the Wikimedia Deutschland e.V. offices in Berlin, Germany. If this sounds like the right event for you, come and join us! Just make sure to list yourself here, so we know how many people will attend and we can plan accordingly. If you have any questions or concerns, join us at the chatroom: sprints@muc.xmpp.org!
- XMPP at FOSSY 2026: This year’s edition of FOSSY, the fourth Free and Open Source Software Yearly conference, will take place during the month of August, from Thursday 6th to Sunday 9th 2026 at the University of British Columbia, Vancouver, Canada. As always, there will be an XMPP Track. The call for proposals remains open until May 22, 2026. Once again, this year JMP is pleased to announce its annual offer for funding to the potential speakers who would like to host a talk on the XMPP track. Please, join them at discuss@conference.soprani.ca, and don’t hesitate to ask for more information!
Videos and Talks
- Mensajería instantánea: por qué recomiendo XMPP, a podcast by Damián Muraña for Cosas de Damián. [ES]
- Conversations (XMPP): Feature-Preview, by eversten.net for XMPP Tutorials DE. [DE] [EN]
- Monal (XMPP): Feature-Preview für Version 7, by eversten.net for XMPP Tutorials DE. [DE]
- Deutschlandfunk Nova: Interview über EU-Regulierung von Instant-Messengern, a radio interview with Daniel Gultsch. [DE]
- XMPP: Instant Messaging that works like email by Polarian and Chewie at oggcamp 2026.
XMPP Articles
- NLnet: 57 Projects Receive NGI Zero Grants to Fix the Internet
- OpenPGP refresh for Conversations: This project aims to modernize PGP encryption within Conversations, a Jabber/XMPP client, by integrating cryptographic operations and adopting updated messaging standards. Furthermore, the project will implement and update the modern OpenPGP standards for XMPP (XEP-0373 and XEP-0374) by making use of Stanza Content Encryption (SCE). This transition not only benefits users who prefer PGP-based encryption but also serves as a critical building block for the development of OMEMOv2.
- Matridge spaces: Matridge is a gateway for XMPP users to transparently chat in Matrix rooms. It is an XMPP server-side component that acts as a Matrix client and makes it possible to pilot a Matrix client from any XMPP client. It implements modern instant messaging features such as rich replies, spaces, attachments, emoji reactions and threads. It is self-hosting friendly, community-lead, written in python and based on slidge, an XMPP gateway library.
- Matridge spaces with NLNet, from the slidge.im blog.
- Experimenting with MariaDB, Firebird and CockroachDB Support in Openfire, by guus for the Ignite Realtime community.
- Bringing jabber.el Back From the Dead, by Thanos Apollo from the thanosapollo posts.
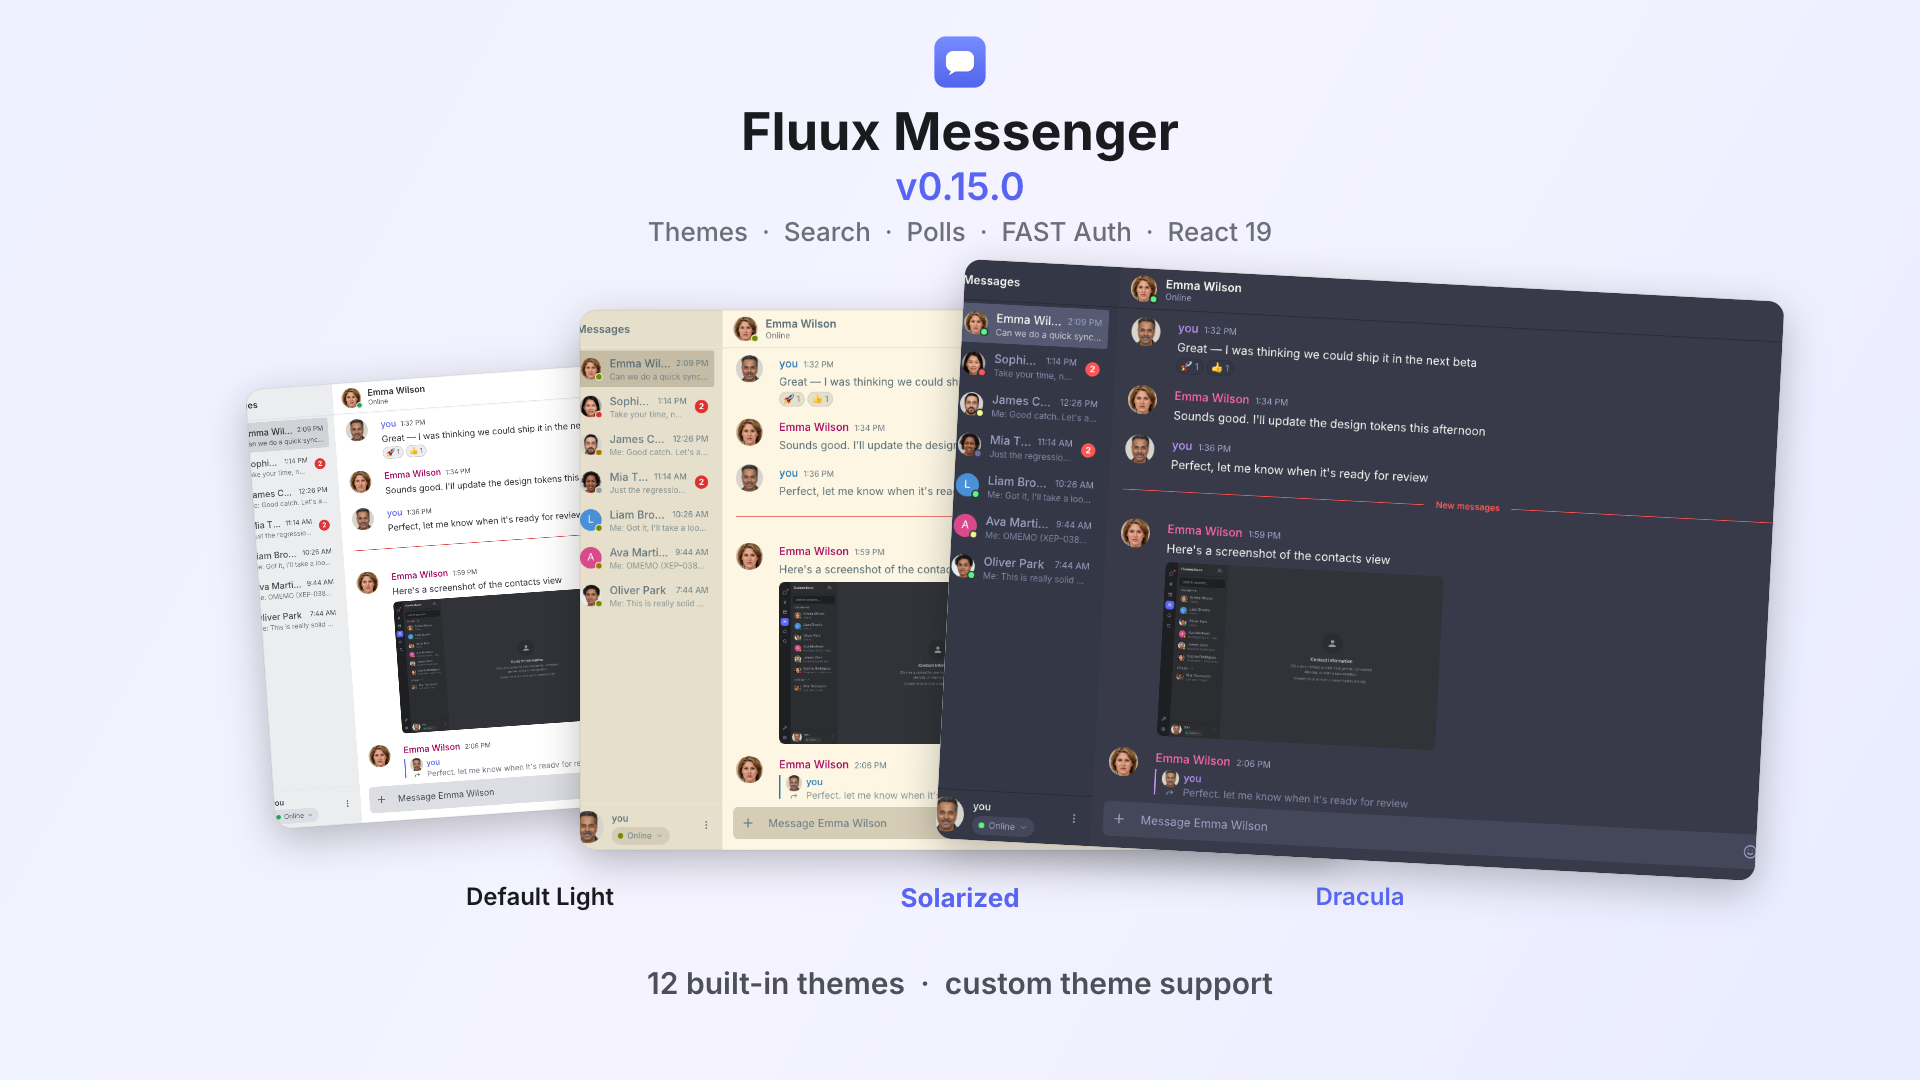
- Fluux Messenger 0.15: Search, Themes, Polls, and a Whole Lot More, by Mickaël Rémond for the ProcessOne blog.
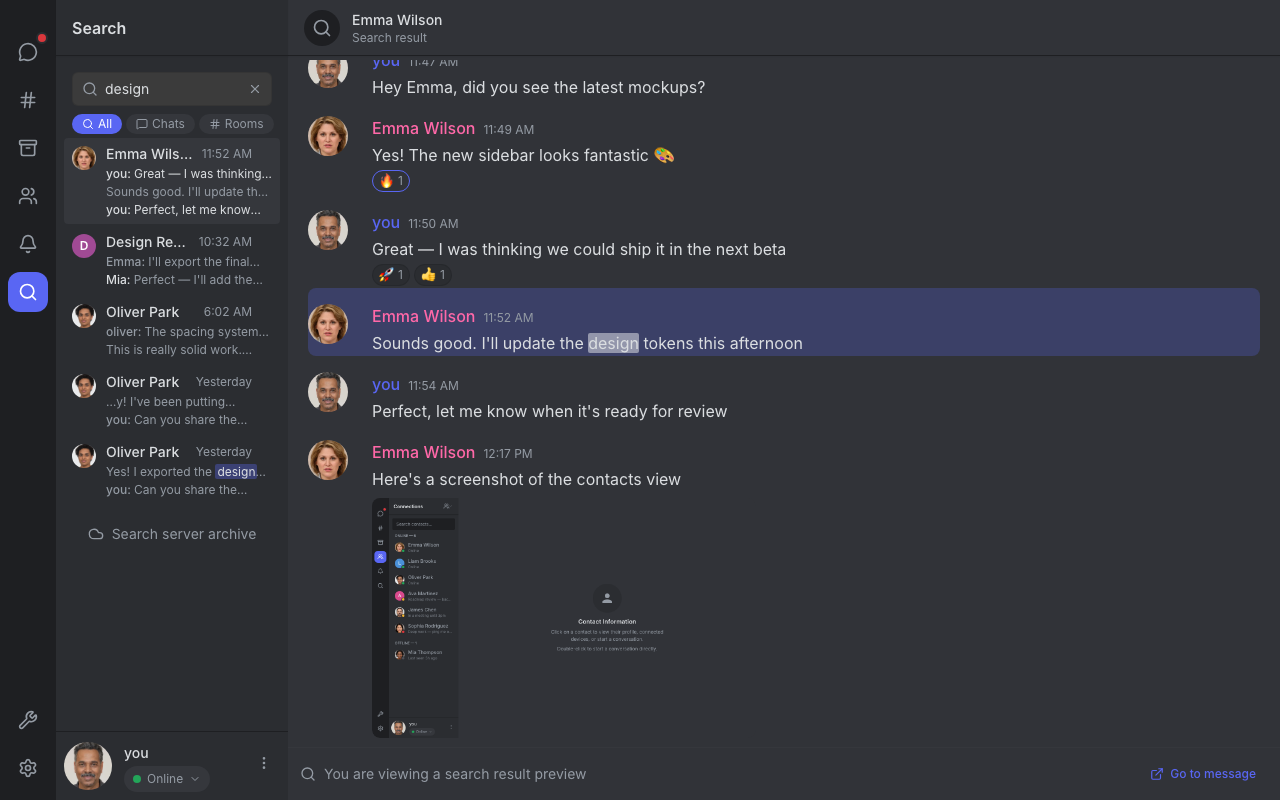
- Full Text Search with IndexedDB, by singpolyma for the JMP blog.
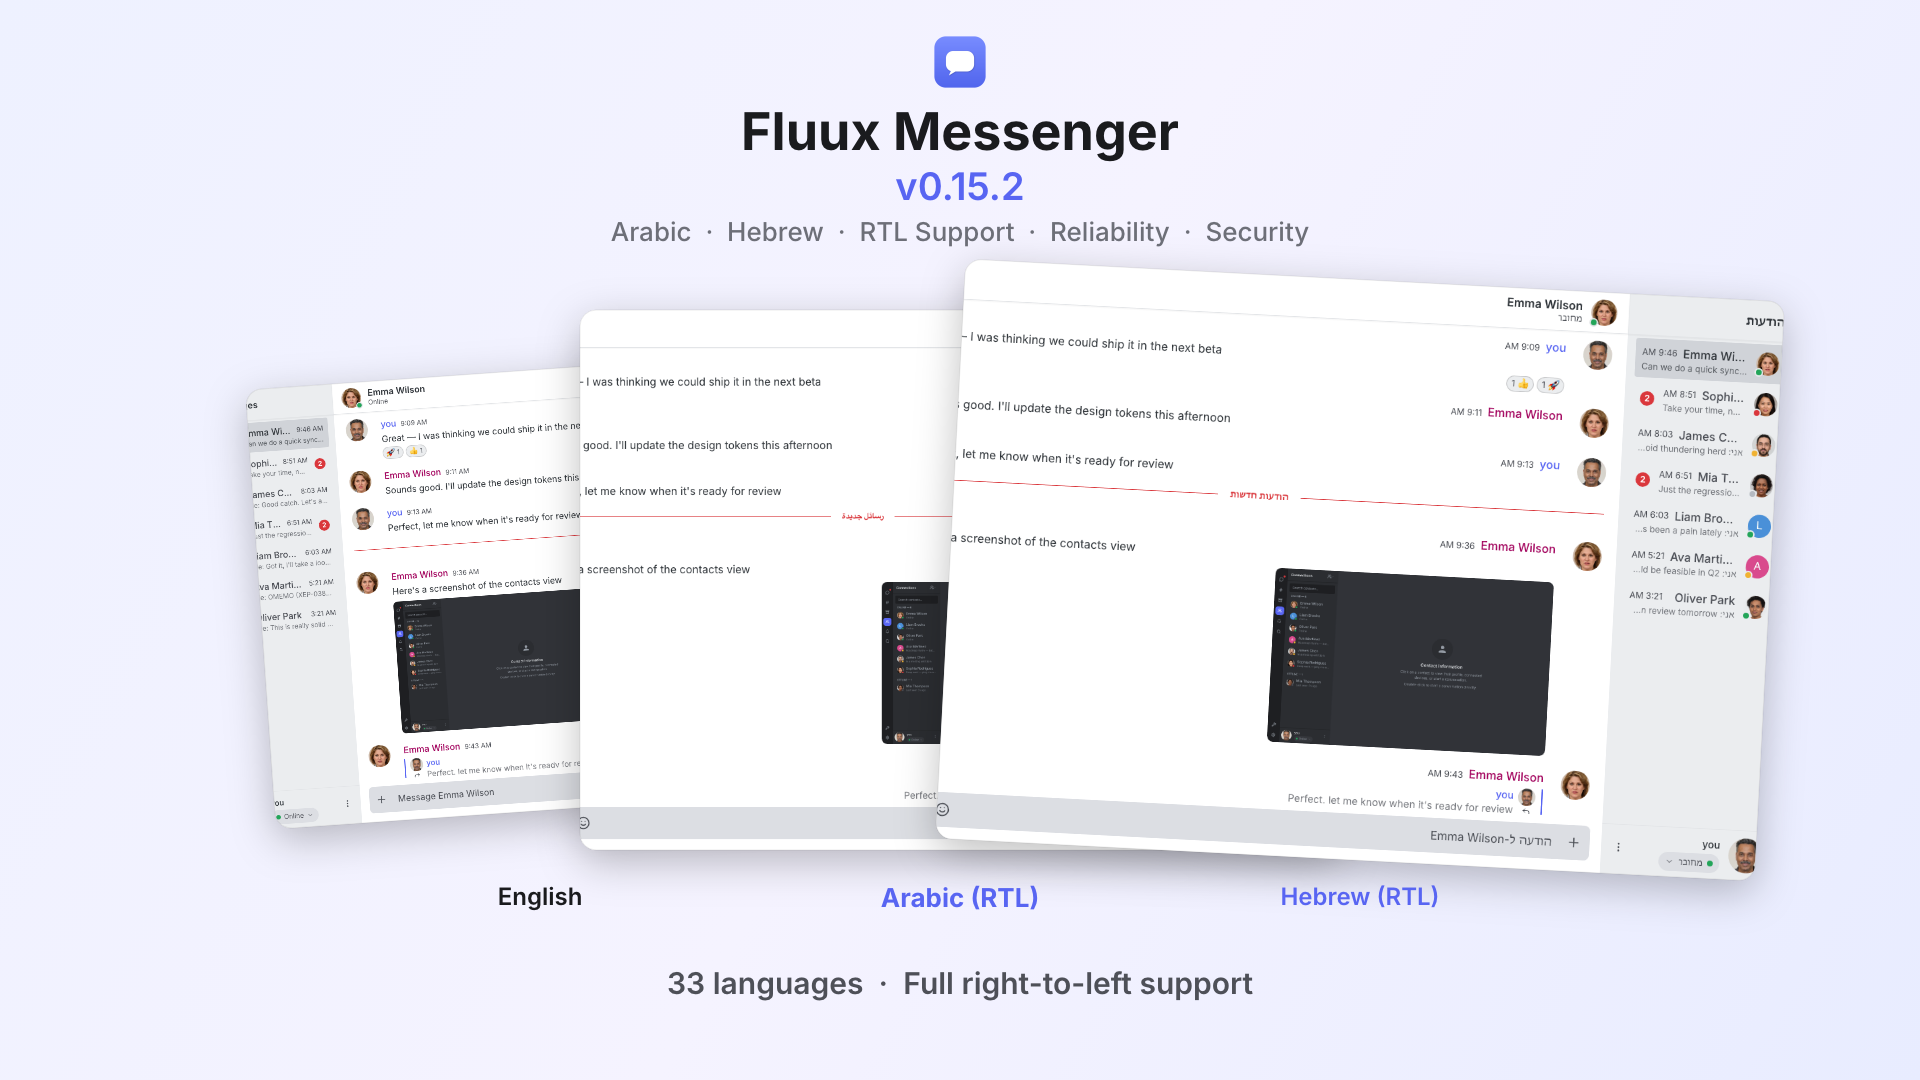
- Fluux Messenger 0.15.2: RTL Support, Faster Reconnection, and a Pile of Reliability Fixes by Mickaël Rémond for the ProcessOne blog.
- Libervia progress note 2026-W16: a complete and comprehensive blog post about the Audio/Video implementation, email gateway, work on installation/configuration simplification and the new forge, focus on web frontend and redesign and work done with current metadata reduction and serverless XMPP (Tor, contacts e2ee, new pubsub implementation) by Goffi.
- Movim 0.33 “Halley” is out!, by Timothée Jaussoin for the Movim Blog.
- XMPP – The Middle Ground Of Instant Messaging: XMPP or Extensible Messaging and Presence Protocol is an open communication protocol. In this article you will learn to install a private, non-federated XMPP server. By Tom’s IT Cafe for the Tom’s IT Cafe blog.
- XMPP como alternativa a Whatsapp, by Runforrest for Runforrest World blog. [ES]
- XMPP: mensajería instantánea libre y federada, by Damián Muraña for Damián Muraña blog. [ES]
XMPP Software News
XMPP Clients and Applications
- aTalk has released versions 5.2.2 and 5.3.0 of its encrypted instant messaging with video call and GPS features for Android. Both versions bring a lot of ‘under the hood’ changes. Please refer to the release notes or check out the intermediate changelog from 5.2.1 to 5.3.0 for all the details.
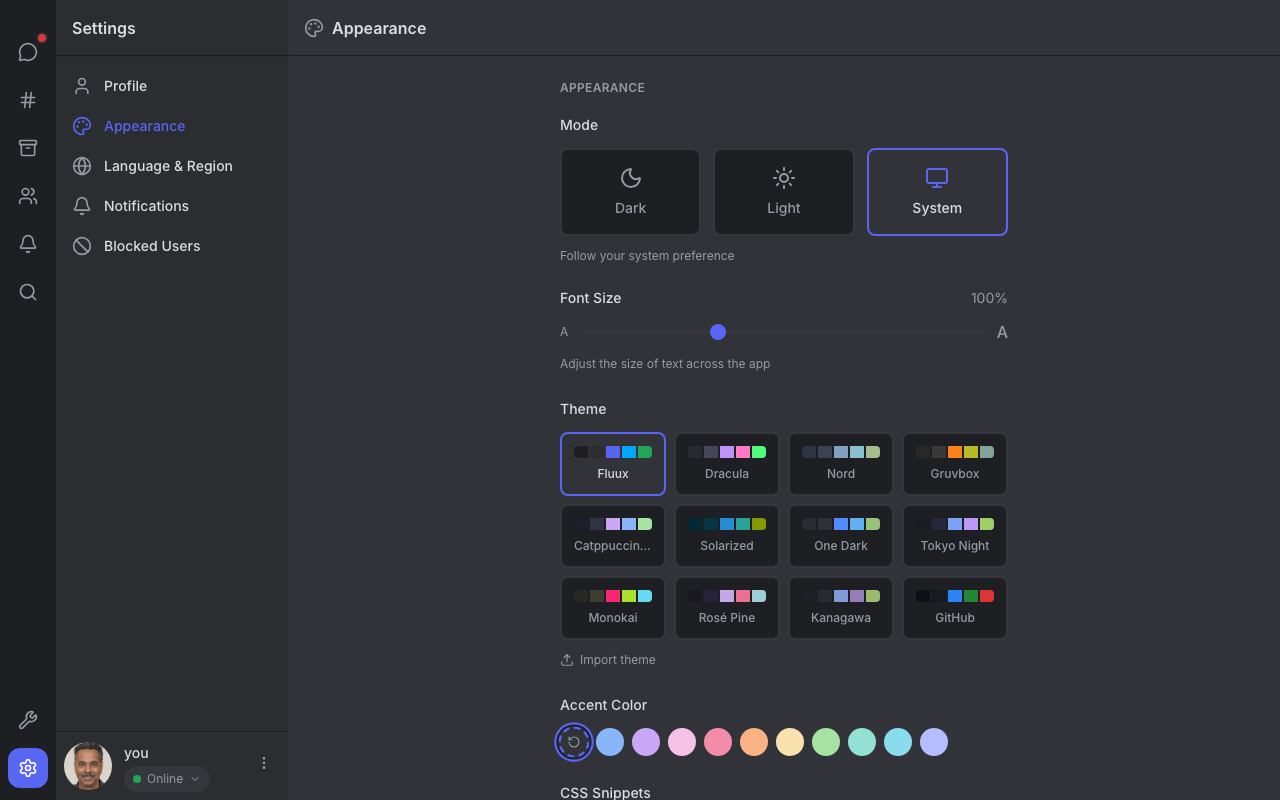
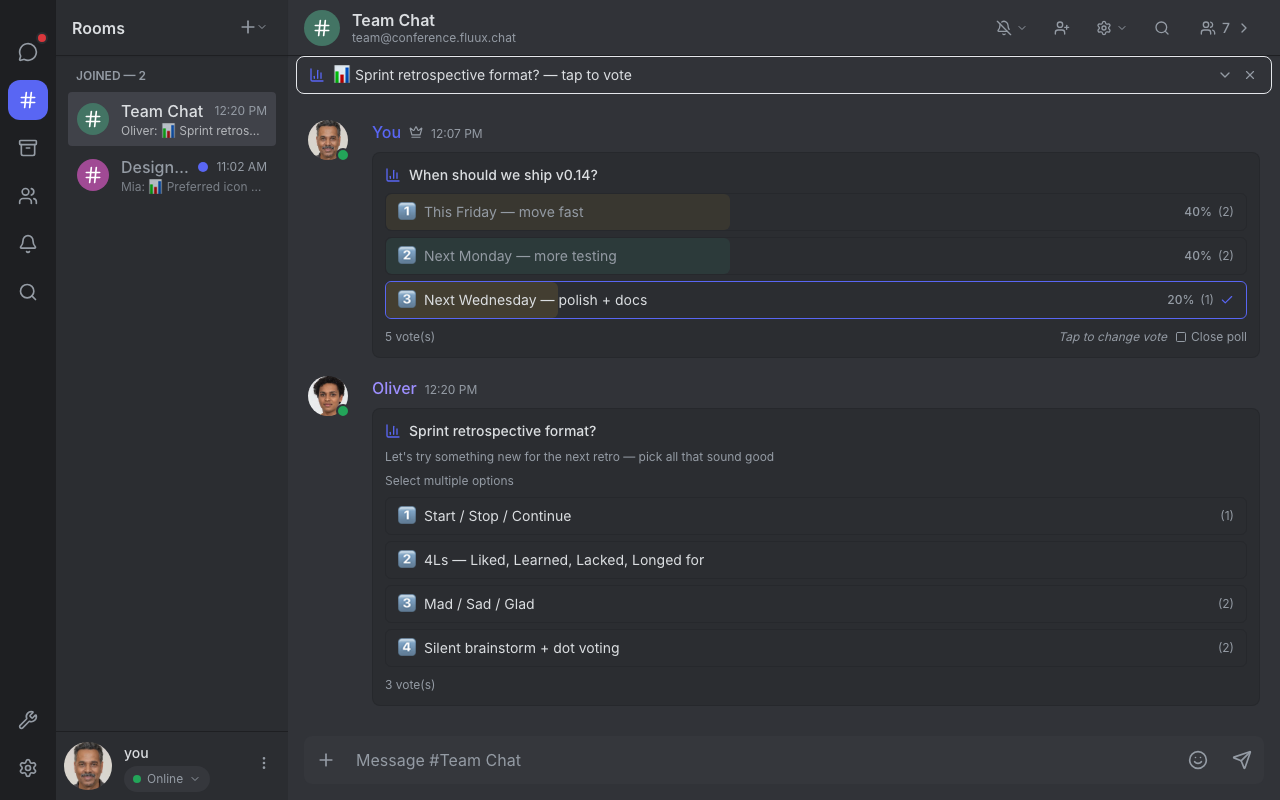
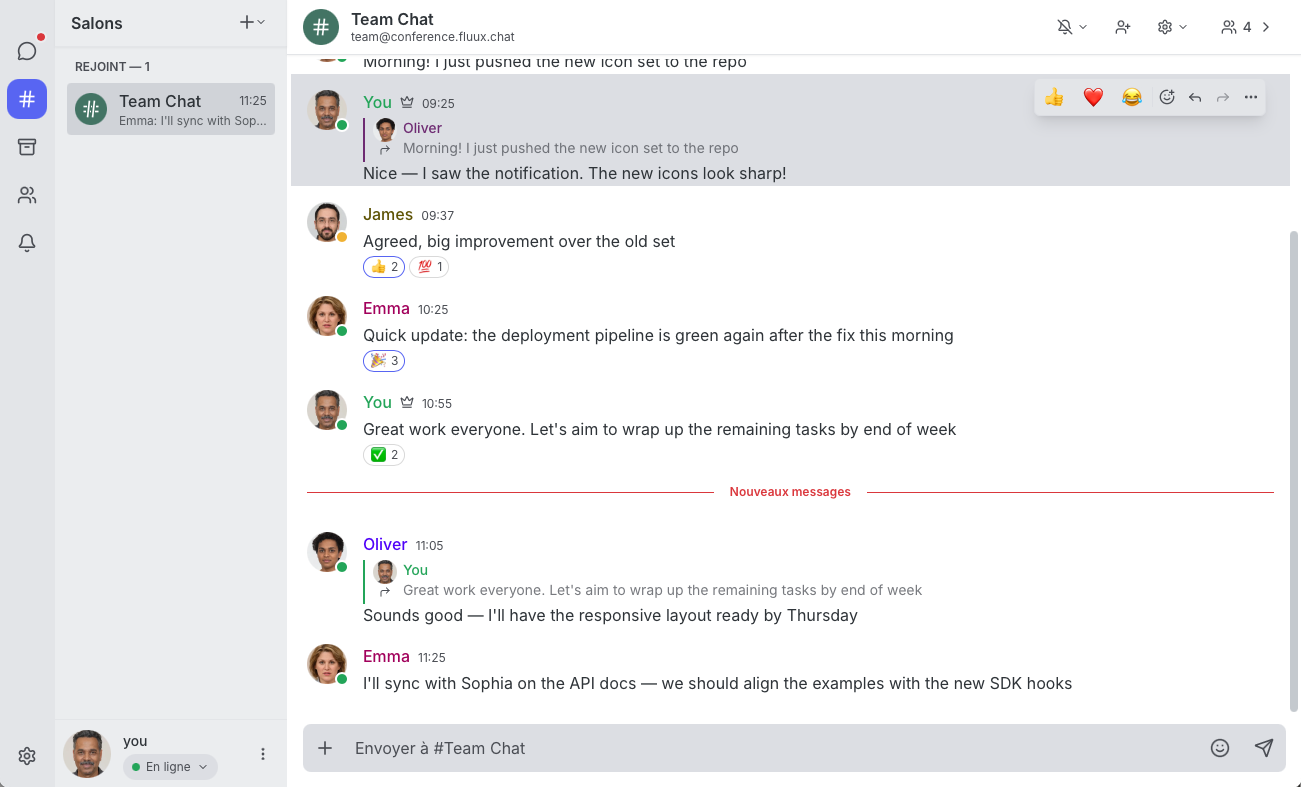
- Fluux Messenger, has released versions 0.15.0, 0.15.1 and 0.15.2, of its modern, cross-platform XMPP client for communities and organizations. These versions introduce a large list of additions and new features like 12 built-in themes, reaction-based polls for MUC rooms with deadlines, full-text message search across all conversations and rooms, font size adjustment buttons, activity log events are clickable and allow you to navigate to the relevant conversation and message, and the ability to disable push notifications just to name a few of them! The list also expands to improvements, bugfixes and it’s way longer than what we can mention in here! Please, go straight to the fulll changelog for all the details, because there are a lot of them!
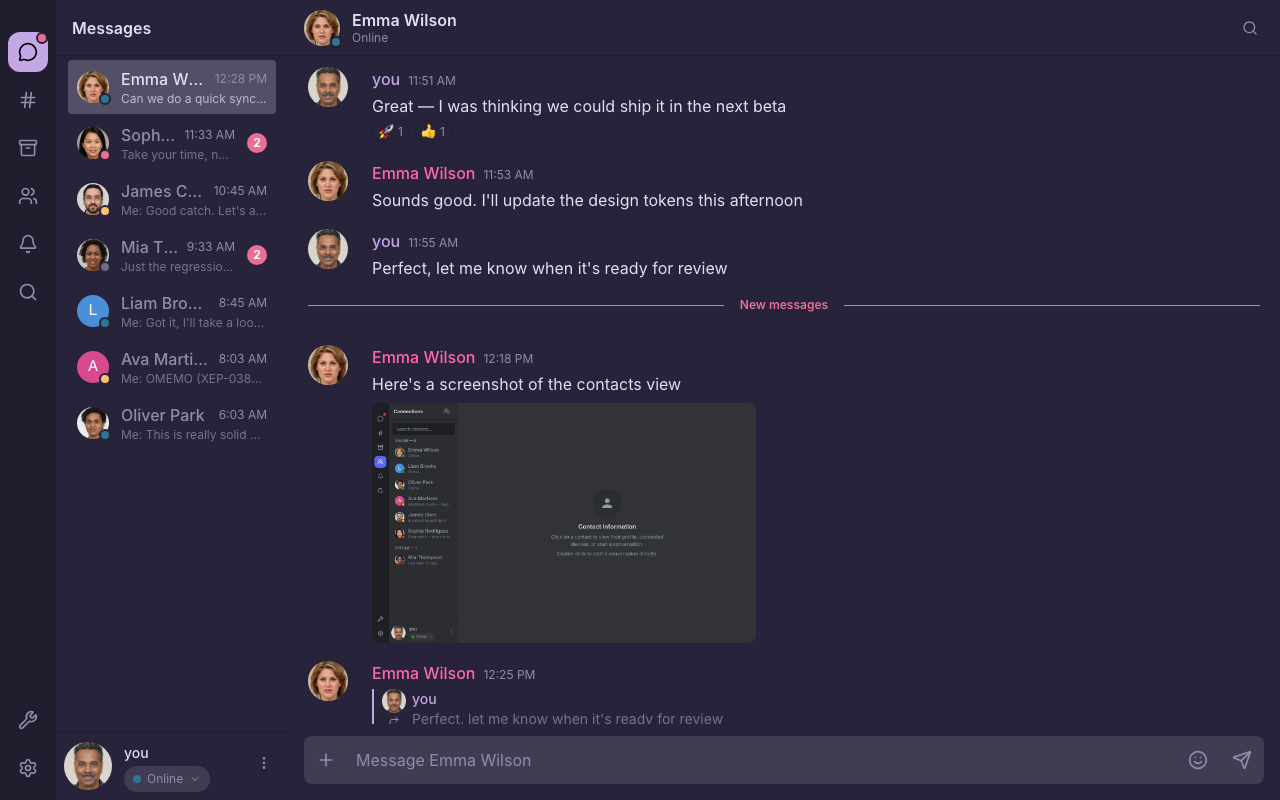
Fluux Messenger Rose Pine theme.
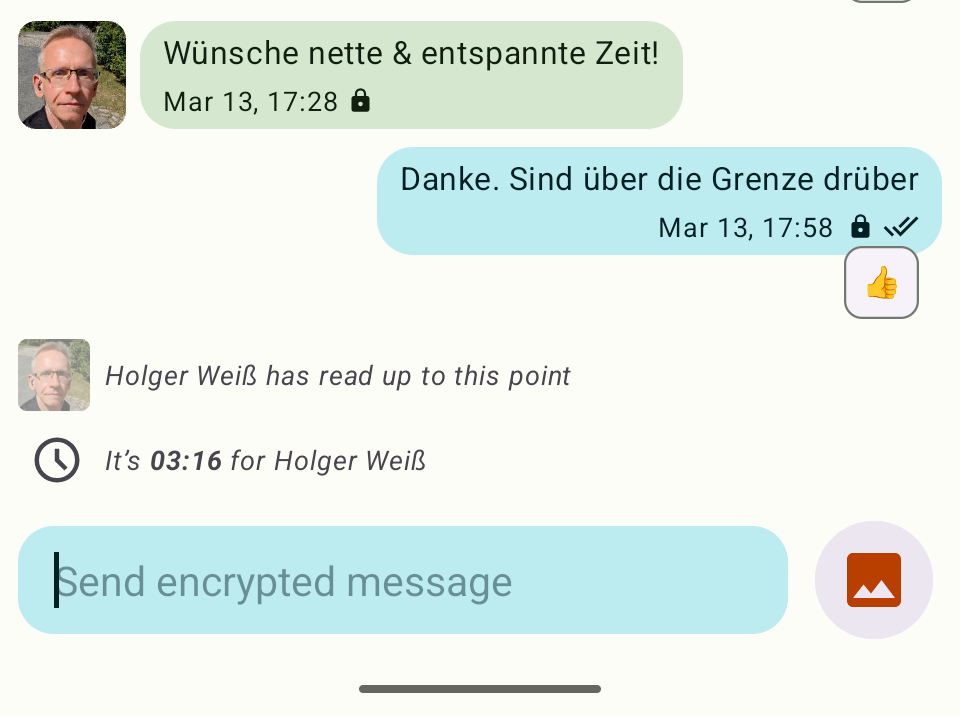
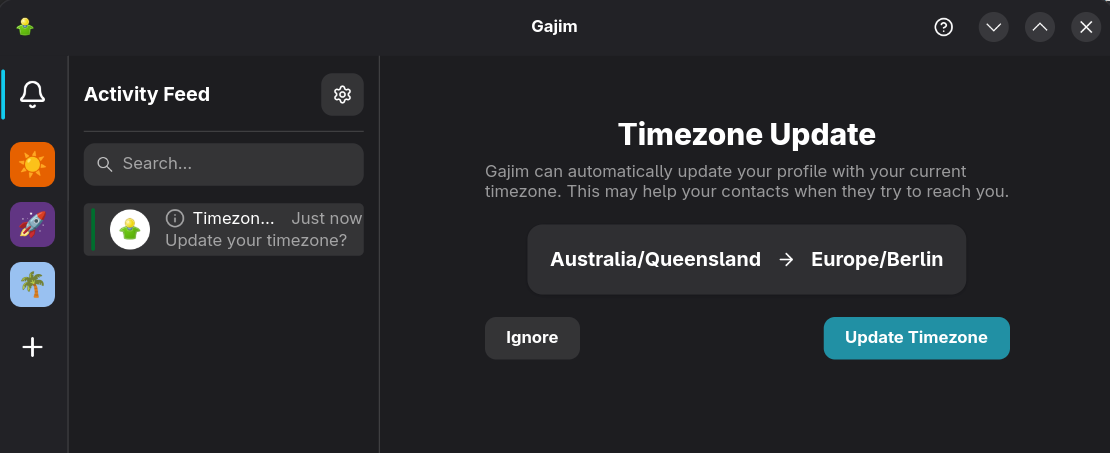
- Gajim has released version 2.4.6 of its free and fully featured chat app for XMPP. This release can now give you a clue if it’s night for your contacts and comes with improvements for the activity feed, better display of mentions, fixed message scrolling, and many bugfixes. Thank you for all your contributions! You can take a look at the changelog for all the details.
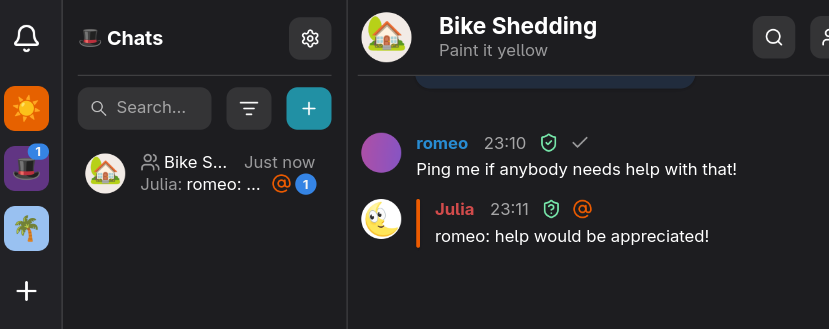
Gajim: A message mentioning you
- Monal has released version 6.4.20 for iOS and macOS with a rather large list of fixes.
- Monocles has released version 2.1.5 of its chat client for Android. This release brings fixes on import settings and hide offline. It implements swipe to previous or next media in preview, clear push notification configuration values, and work on UnifiedPush to add support for link activity among other niceties!
- Movim has released version 0.33, code named Halley! After months of work and hundreds of commits, this is the biggest Movim release ever made. This release massively scales up Movim’s architecture while introducing long-awaited, and exclusive, new features like spaces, shortcuts, hats, swipe to reply, videoconference, audio and screen sharing, categorizing content during calls, refactored notifications, new administration tools and accessibility improvements, a big Funding Campaign for 2026, and even two new mascots: Miho and Stash! A lot of work was also done to improve accessibility thanks to NLnet funding. Head over the official release announcement and dive directly into the exciting things you can find in this release!
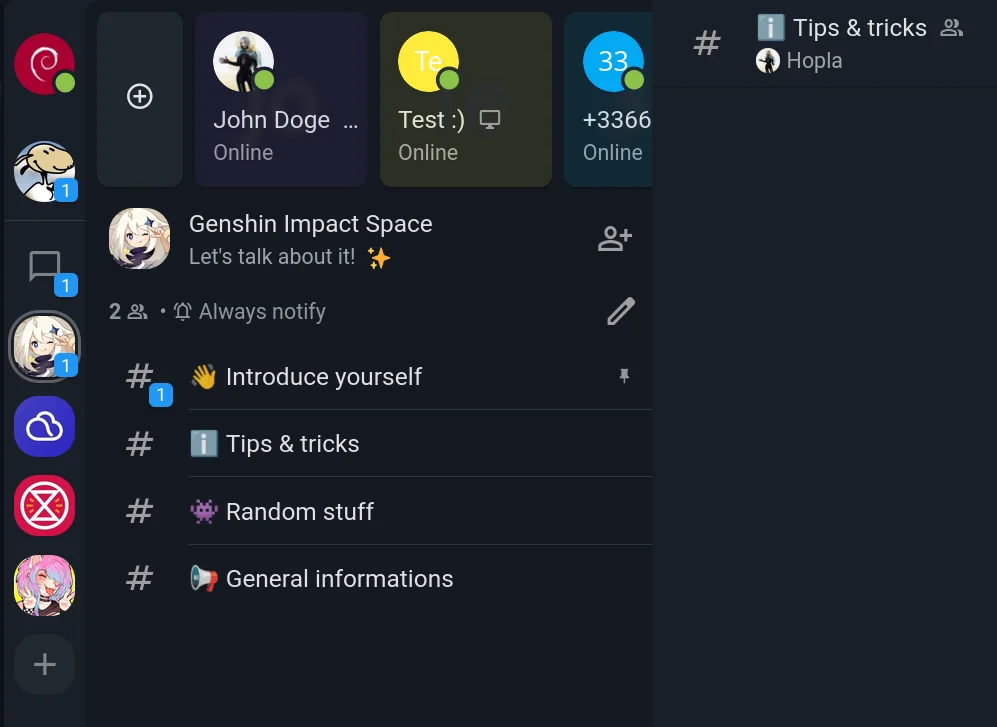
Movim: Spaces; already compatible with ejabberd. Prosody support coming very soon!
- Poezio has released versions 0.16.1 and 0.17 of its console XMPP client. The former is a bugfix release that brings mostly fixes and internal stuff, but also adds the ability to see redacted/moderated messages if you wish so, particularly useful if you are the one moderating. The latter is a small release focused on receiving and sending message reactions! You can find all the details in their respective links.

Poezio: receiving message reactions

Poezio: sending message reactions
- Profanity has released version 0.18.0 of its console based XMPP client written in C. This release adds spellcheck highlighting support and implements asynchronous external editor support while introducing quite a few bugfixes. Please make sure to read the changelog for all the details!
XMPP Servers
- ProcessOne has released ejabberd 26.04. This security release includes options to limit XML parser, and other minor bugfixes. It is strongly encouraged that you update ejabberd as soon as possible. Make sure to read the changelog for all the details and a complete list of fixes and improvements on this release.
- Prosody IM is pleased to announce versions 13.0.5 and 0.12.6. These are security releases for the Prosody 13.0.x stable series and for the old Prosody 0.12.x old stable series respectively. They fix multiple security issues, some memory leaks, some smaller bugs and changes which have been implemented since the previous releases. Full details about the security vulnerabilities can be found in the security advisory. All Prosody operators on 13.0.4 or earlier, or on 0.12.5 or earlier, are encouraged to upgrade to 13.0.5 and/or 0.12.6 as soon as possible, or to review the advisory and implement appropriate mitigations. Read changelog for all the details, and as always, detailed download and install instructions are available on the download page for your convenience. Note: Support for the 0.12.x series ends in June 2026. This means it will no longer receive any fixes or updates, even for security issues. It is likely that 0.12.6 will be the last release from this series. Check out the guide on upgrading Prosody and the release notes for 13.0.0 before you upgrade to the 13.0.x series.
XMPP Libraries & Tools
- jabber.el, the XMPP client for Emacs, versions 0.10.0 to 0.10.6 have been released. Full details on all the releases in the changelog.
- librssguard-xmpp, a plugin for the RSS Guard desktop feed reader that offers basic XMPP support to fetch real-time (push) ATOM/PubSub entries and single/multi user chat messages.
- python-nbxmpp, a Python library that provides a way for Python applications to use the XMPP network, version 7.2.0 has been released. Full details on the changelog.
- QXmpp, the cross-platform C++ XMPP client and server library, versions 1.14.6, 1.14.7, 1.15.0 and 1.15.1 have been released. Full details on the changelog.
- Slidge versions 0.3.8 and 0.3.9 have been released. The former comes with the usual bug fixes and introduces image link previews and contact- and room-specific commands along with a lot of internal changes to improve the code maintainability. The latter is a bugfix release, notably for a crash triggered by using chat commands introduced by a refactor of the commands system in the previous release. You can check the intermediate changelog from 0.3.7 to 0.3.9 for all the details.
Extensions and specifications
The XMPP Standards Foundation develops extensions to XMPP in its XEP series in addition to XMPP RFCs. Developers and other standards experts from around the world collaborate on these extensions, developing new specifications for emerging practices, and refining existing ways of doing things. Proposed by anybody, the particularly successful ones end up as Final or Active - depending on their type - while others are carefully archived as Deferred. This life cycle is described in XEP-0001, which contains the formal and canonical definitions for the types, states, and processes. Read more about the standards process. Communication around Standards and Extensions happens in the Standards Mailing List (online archive).
Proposed
The XEP development process starts by writing up an idea and submitting it to the XMPP Editor. Within two weeks, the Council decides whether to accept this proposal as an Experimental XEP.
- Message Archive Management: Trim Command
- This specification describes how a client can request “trimming” of an archive.
- Group Chat Reporting
- This specification describes how a client can report abuse and spam in a MUC or other group chat context.
- Occupant Mute Synchronization
- Allows synchronizing a list of muted group chat participants between multiple clients.
- New MUC
- This document specifies an enhanced Multi-User Chat protocol that is broadly backwards compatible with that of XEP-0045(Multi-User Chat), but adds a number of key improvements.
- Payment Required
- This specification defines an XMPP protocol extension that enables services to require payment before granting access to a resource. It provides a payment-system neutral invoice format supporting multiple concurrent payment options, including bank transfers (SEPA, IBAN, UPI) and instant-settlement networks (Lightning Network), and integrates with the existing CAPTCHA challenge mechanism defined in XEP-0158 (CAPTCHA Forms).
- Emoji Markup
- This specification leverages Message Markup and Stateless file sharing or Stateless Inline Media Sharing (SIMS) to send custom emojis.
New
- Version 5.6.7.8 of XEP-0512 (XMPP as Interpretive Dance)
- Initial published version. (gdk)
- Version 0.1.0 of XEP-0513 (Explicit Mentions)
- Accepted as Experimental by council vote on 2026-03-31 (dg)
Deferred
If an experimental XEP is not updated for more than twelve months, it will be moved off Experimental to Deferred. If there is another update, it will put the XEP back onto Experimental.
- No XEPs deferred this month.
Updated
- Version 1.35.4 of XEP-0045 (Multi-User Chat)
- Add clarification how to unset a reserved nickname when modifying the member list.
- Split passage which defines how to modify the member list into multiple sentences to improve readability. (ph)
- Version 1.1.0 of XEP-0345 (Form of Membership Applications)
- Apply policy changes after Board vote on 2026-04-16.
- Allow Legal Name to be provided privately to the Secretary instead of published.
- Add support for alternative public identifiers.
- Clarify handling of private information and alignment with XSF disclosure policy. (gdk)
- Version 0.9.1 of XEP-0384 (OMEMO Encryption)
- Fix using
id=0in examples. Spec requires positive numbers. (XEP Editor: dg)
- Fix using
- Version 0.2.1 of XEP-0413 (Order-By)
- Replace old namespace use in examples. (jp)
- Version 0.2.0 of XEP-0509 (Initial Authentication Pipelining)
- Updates based on implementation. (dwd)
Last Call
Last calls are issued once everyone seems satisfied with the current XEP status. After the Council decides whether the XEP seems ready, the XMPP Editor issues a Last Call for comments. The feedback gathered during the Last Call can help improve the XEP before returning it to the Council for advancement to Stable.
- No Last Call this month.
Stable
- No stable XEPs this month.
Deprecated
- No XEPs deprecated this month.
Rejected
- No XEPs rejected this month.
Spread the news
Please share the news on other networks:
- Mastodon
- Movim
- Bluesky
- YouTube
- Lemmy instance (unofficial)
- Reddit (unofficial)
- XMPP Facebook page (unofficial)
Subscribe to the monthly XMPP newsletter
SubscribeAlso check out our RSS Feed!
Looking for job offers or want to hire a professional consultant for your XMPP project? Visit our XMPP job board.
Newsletter Contributors & Translations
This is a community effort, and we would like to thank translators for their contributions. Volunteers and more languages are welcome! Translations of the XMPP Newsletter will be released here (with some delay):
-
Contributors:
- To this issue: emus, cal0pteryx, Gonzalo Raúl Nemmi, Ludovic Bocquet, XSF iTeam
-
Translations:
- French: Adrien Bourmault (neox), alkino, anubis, Arkem, Benoît Sibaud, mathieui, nyco, Pierre Jarillon, Ppjet6, Ysabeau
- Italian: Mario Sabatino, Roberto Resoli
- Portuguese: Paulo
Help us to build the newsletter
This XMPP Newsletter is produced collaboratively by the XMPP community. Each month’s newsletter issue is drafted in this simple pad. At the end of each month, the pad’s content is merged into the XSF GitHub repository. We are always happy to welcome contributors. Do not hesitate to join the discussion in our XSF Communications Team group chat (MUC) and thereby help us sustain this as a community effort. You have a project and want to spread the news? Please consider sharing your news or events here, and promote it to a large audience.
Tasks we do on a regular basis:
- gathering news in the XMPP universe
- short summaries of news and events
- summary of the monthly communication on extensions (XEPs)
- review of the newsletter draft
- preparation of media images
- translations
- communication via media accounts
Unsubscribe from the XMPP Newsletter
For this newsletter either log in here and unsubscribe or simply send an email to newsletter-leave@xmpp.org. (If you have not previously logged in, you may need to set up an account with the appropriate email address.)
License
This newsletter is published under CC BY-SA license.
